Introducing a Clinical Course-Graphing Scale for DSM-5 Mood Disorders
Abstract
Assessment of clinical course to aid in the diagnosis of patients and to guide treatment planning has gained momentum in recent years. A course-graphing scale for the DSM-5 Mood Disorders is presented to facilitate clinical history-taking and diagnosis of the mood disorders during the screening interview. The scale can be administered in the more traditional history-taking portion of the screening interview. The only difference is that it is a more systematic approach especially when the clinician suspects the presence of a mood disorder. The Timeline Course Graphing Scale for the DSM-5 Mood Disorders (TCGS) is described and accompanied with guidelines for administration.
Introducing a Course-Graphing Scale for DSM-5 Mood Disorders
A course graphing scale is presented to improve the diagnostic accuracy of the Diagnostic and Statistical Manual-5 (DSM) mood disorders. The graphing scale, the Timeline Course Graphing Scale for the DSM-5 Mood Disorders (TCGS), helps clinicians differentiate between the unipolar and bipolar mood disorders. Before describing the scale and how to administer it, several previous research efforts involving the assessment of clinical course are described.
Introduction
Emerging Clinical Course Specifier Emphases in the DSMs since 1980
Clinical course, the manifestations of a patient’s psychological disorder over time, has gained increasing importance since 1980. The evolving course descriptions in the Diagnostic and Statistical Manuals published since 1980 reveal a growing emphasis on the long-term clinical course characteristics of disorders. For example, in DSM-III (APA, 1980) a brief clinical course description under the heading course was inserted within the text for each diagnostic category. The explosion of clinical research following the publication of DSM-III resulted in the elaboration of course information in the DSM-III-R (APA, 1987) under several headings: age-specific features; age of onset; and course. Beginning with DSM-IV (APA, 1994) and continuing with DSM-IV-TR (APA, 2000) attention to characterizing clinical course is evident in the specifier course graphs appearing in the mood disorder section of DSM-IV (p. 388) and DSM-IV-TR (p. 425). The DSM-5 (APA, 2013), informed by further clinical research, increasingly delineates course specifiers—permutations within the disorder categories.
During the late 1980s and 1990s, research in chronic depression made differentiating acute/episodic major depression from chronic depression an important diagnostic issue. To facilitate the differential diagnostic task and to enhance diagnostic accuracy, McCullough and colleagues (2001; 1996) proposed a visual course graphing procedure. The graphing methodology developed by McCullough et al. was used reliably in two clinical trials (Keller et al., 2000; Kocsis et al., 2009; First et al., 1995). The graphing procedure was inserted in a revised version of the Structured Clinical Interview for DSM-IV Axis I Disorders: Patient Edition (SCID-P) (First et al., 1995) and became the forerunner of the Timeline Course Graphing Scale (TCGS) to be described below.
Recent prospective studies of mood disorders using clinical course methodology are in the literature (Birmaher et al., 2006; Klein et al., 2000; Klein et al., 2006; Judd et al., 2002; Judd et al., 2003; Post et al., 2003). Two papers (Klein et al., 2000; Klein et al., 2006) represented the same 10-year prospective investigation describing the course and outcome of dysthymic patients. Ninety-seven adults diagnosed with early–onset dysthymia were enrolled and assessed during months 30, 60, 90, and 120. The major conclusion reported was that dysthymia has a protracted and refractory course associated with high rates of relapse.
One caveat must be stated here. The TCGS should not be confused with the recently published NIMH Life Chart Method (LCM-p) proposed and described by Post and colleagues (Denicoff, Leverich, Nolen et al., 2000; Post, Denicoff, Leverich, et al., 2003). The NIMH LCM-p is a much more complicated instrument compared to the TCGS and was primarily constructed as a prospective study of the fluctuating symptoms of bipolar illness; TCGS is a one-time history-taking diagnostic screening instrument.
Rationale for Making Clinical Course Trajectories Explicit
Since the DSM-5 category of Persistent Depression Disorder ([PDD] APA, 2013) is novel for most practitioners some clinicians may have difficulty discriminating between episodic Major Depressive Disorder (MDD) and Persistent (chronic) Depression. It seems simple to ask patients, “How long have you been depressed?” and then differentiate MDD and PDD. Why then is it advantageous to be more systematic in investigating the mood disorders? The reason is obtaining differential-diagnostic information from patients is not always simple. For example, some patients have difficulty recalling the duration of their illness, others overlook or ignore early onset, which, not infrequently, is accompanied by a history of early abuse and trauma (Cicchette & Toth, 1998; Felitti & Anda, 2010; McCullough, 2012; McCullough et al., 2015). The first author (McCullough, 2012; 2015) reported that failure to correctly discriminate between episodic MDD and PDD may lead to inadequate treatment. During the past decade, he treated some patients with PDD who were previously misdiagnosed as having Bipolar I Disorder, Bipolar II Disorder, “chronic” PTSD, cyclothymic disorder and even schizophrenia. Having a simple means to graph the course of mood might make the differential diagnostic task easier and less error-prone. The TCGS and its administration procedures are described below.
Timeline Course Graphing Scale for the DSM-5 Mood Disorders
Unipolar & Bipolar Disorders
Timeline Scale I:Procedural Steps
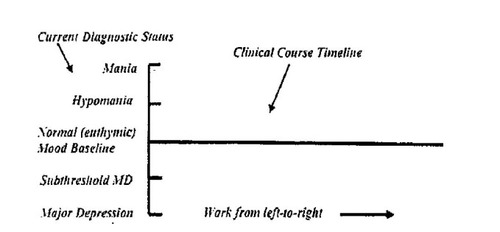
The clinician working with the patient uses a figure that looks like the one illustrated below (see Figure 1). The vertical line denotes the current diagnostic status while the horizontal line illustrates the clinical course of the disorder and serves as an indicator for normal (euthymic) mood.

Figure 1. MODEL TO USE FOR COURSE GRAPHING PROCEDURE FORM
The process is an iterative one. Clinicians use DSM-5 diagnostic criteria to discriminate between moderate-severe levels of euphoria/irritability, implicating a) mania and mild euphoria/irritability accompanying hypomania; similarly, b) moderate-severe levels of depression will suggest MDD (Major Depression Disorder requires ≥ 1 Major Depressive Episodes (MDE) with an absence of bipolar disorder). Milder depression indicates subthreshold Major Depression [MD]. Dysthymia diagnosis requires ≥ two years of depression with an absence of bipolar symptoms. Once a current diagnosis is determined, a notation mark (“x”) is placed on the vertical line adjacent to the appropriate category. The clinical course is then plotted from left (present time) to right (past time). To some practitioners and researchers, working from left (present) to right (past) may appear contrary to conventional ways of graphing timelines. We have found working from left to right easier. When patients have difficulty recalling disorder-duration periods, ask them to indicate dates for birthdays, anniversaries and/or national holidays. Marking these occasions on the timeline may facilitate recall.
Graphing Procedure for a Bipolar Disorder when the Patient Presents with Manic or Hypomanic Symptoms:
| Step One: | The clinician inquires about the presence of DSM-5 symptoms for a Manic Episode or Hypomanic Episode (Mania: Criterion A: one-week duration or, any duration if hospitalization is necessary; Hypomania: Criterion A: four consecutive days). An “x” notation indicating the diagnosis is inserted adjacent the appropriate disorder point (see Figure 1). The patient is then asked the question: “How long have you feltjust the wayyou are feeling right now?” Begin from the “x” notation representing the current diagnosis, the first horizontal line drawn extends back in time and represents the best estimate of the duration/length of time the patient has felt the way he described feeling once the diagnosis was made. Similarly, once the symptom-level duration is set, three questions are asked:
The questioning procedure is repeated as the clinician works back in time. | ||||||||||||||||||||||
| Step Two: | Patients with Bipolar Disorder I and II will have to be queried further to determine the profile course of their cycling history; in addition, a subthreshold MD or MDE diagnosis will have to be made at each shift/change point when the manic or hypomanic levels move into a depressive domain. The Rapid Cycling specifier is administered if there have been at least four mood disorder episodes in the previous 12 months. This pattern should be evident on the course profile graph. | ||||||||||||||||||||||
| Step Three: | For cases in which the symptom level does not meet hypomania criteria during the screening interview, the clinician must determine the duration of this period of elevated mood by asking the duration questions described above at each shift/change point. If depressive periods have occurred at the shift/change points, and if there are numerous cycling shifts evident between hypomania and depression during a two-year period (one year in children and adolescents), and if criteria for MDE are not met, then Cyclothymic Disorder (cyclothymia: requires that manic episode and hypomanic episode have never been met) is diagnosed. | ||||||||||||||||||||||
| Step Four: | One exception to dividing the course of the mood disorders into either a bipolar or unipolar disorder occurs in Mixed Features cases, in which simultaneous graphing above and below the euthymic mood baseline is required to illustrate the mixed pattern. The upper part of the graph will indicate the elevated/irritable symptoms while the lower part will illustrates the course of the MDEs or subthreshold MDEs. Summarily, bipolar patients report one of two-course patterns--one illustrates a non-mixed course while the second implicates the “mixed state:” (1) patients with manic/hypomanic episodes and depressive symptoms that do NOT overlap at any time during the course; and (2) those patients in which depressive and manic/hypomanic symptoms are “mixed” and occur simultaneously at some point during the course.” Mixed Features State cases will require two passes through the graphing procedure: (1) the first pass obtains the lifetime pattern of the manic/hypomanic symptoms; (2) the second pass probes for the lifetime pattern of the depressive symptoms. Whether the clinician starts with the manic/hypomanic or depressive graphing depends on the current clinical state (i.e. whichever is most prominent at screening). | ||||||||||||||||||||||
Graphing Procedure for a Unipolar Diagnosis when the Patient Presents with Depressive Symptoms:
| Step One: | The clinician begins the TCGS by determining if the Major Depressive Disorder criteria are met. If the diagnosis is MDD, then the notation “x” is placed adjacent to the MDD point. Then, one probes further to determine if the current MDD is a single episode or if the person’s mood meets the specifier criteria for a recurrent pattern of MDD. This is done by asking three questions:
| ||||||||||||||||||||||
| Step Two: | If a patient presents with sub-threshold MDD, query for a possible Dysthymic diagnosis (DD) or Persistent Depressive Disorder (PDD) with intermittent MD episodes without current episode. Employ the same three-question sequence stated above to determine if Pure Dysthymic Syndrome criteria are met (no MDE episodes in the last two years for adults and one year for children and adolescents); if the Pure Dysthymic criteria are met, the appropriate diagnosis is Persistent Depressive Disorder with Pure Dysthymic Syndrome. If it becomes apparent upon questioning that intermittent MDE episodes have been present, but the patient does not currently meet criteria for MDE, the correct diagnosis is PDD with intermittent MD episodes without current episode. | ||||||||||||||||||||||
| Step Three: | If MDD criteria are currently met, and the disorder has continued for a minimum of two years (1-year for children and adolescents), questioning for the course of MDD may result in one of two Persistent Depressive Disorder specifiers, (PDD with persistent MD episode; PDD with intermittent MD episodes, with current episode). | ||||||||||||||||||||||
| Step Four: | See above for in the Bipolar Section for charting Mixed State cases. | ||||||||||||||||||||||

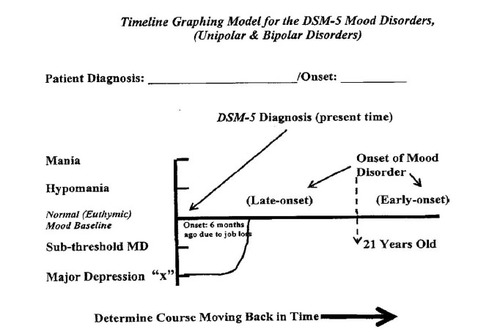
Figure 2. DSM-5 MOOD DISORDER GRAPHING MODEL
Describing the clinical course of a six-month Major Depressive Episode working from the time of the diagnostic interview backward in time.
Summarizing once more the important questions that make the TCGS procedure work, [we repeat the questions that must be asked when symptom intensity varies at every shift/change point. The questions are as follows:
| • | What was the approximate date here when you started feeling just the way you are feeling right now? (Determining the first change/shift point). | ||||
| • | Did your euphoria/irritability become greater, less intense, return to a normal (euthymic level) or did you become depressed? [Mania or Hypomania] | ||||
| • | Did you feel better or worse at this point, or did your mood return to a normal (euthymic) mood baseline? [Unipolar Depression] | ||||
| • | How long did you feel this way? (after each change/shift point is identified) | ||||
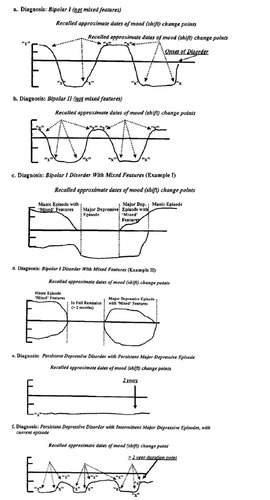
Examples are shown in figures below, 3 a, b, c, d, e, f, for several bipolar and unipolar diagnoses to illustrate what the course graphing profiles for these disorders may look like.

Figure 3. COURSE GRAPHING EXAMPLES FOR SOME OF THE DSM-5 MOOD DISORDERS
(Refer to Figure 2 as needed).
Conclusion
In recent years, clinical course methodology has received increasing emphasis in the diagnosis of mood disorder patients. A course graphing scale, the Timeline Course Graphing Scale for the DSM-5 Mood Disorders has been described herein. It is proposed to help clinicians strengthen the history-taking portion of their screening interviews. Steps to administer the TCGS accompanied the description of the instrument. Hopefully, the TCGS will facilitate clinicians in their history-taking by making the procedure more systematic as well as clarify the diagnostic challenges that mood disorder patients present.
(2006). Clinical course of children and adolescents with bipolar spectrum disorders. Archives of General Psychiatry, 63, 175–183.Crossref, Medline, Google Scholar
(1998). The development of depression in children and adolescents. American Psychologist, 53, 221–241.Crossref, Medline, Google Scholar
(2000). Validation of the prospective NIMH-Life Chart Method (NIMH-LCM-p) for longitudinal assessment of bipolar illness. Psychological Medicine, 30, 1391–1397.Crossref, Medline, Google Scholar
(2010). The relationship of adverse childhood experiences to adult medical disease, psychiatric disorders, and sexual behavior: Implications for healthcare. In R. LaniusE. Vermetten (Eds.), The hidden epidemic: The impact of early life trauma on health and disease (pp. 77–87). New York: Cambridge University.Crossref, Google Scholar
(1995). Structured clinical interview for DSM-IV axis I disorders: Patient Edition (SCID-P). New York: Biometrics Research Department. New York State Psychiatric Institute.Google Scholar
(2002). The long-term natural history of the weekly symptomatic status of bipolar I disorder. Archive of General Psychiatry, 59, 530–537.Crossref, Medline, Google Scholar
(2003). Long-term symptomatic status of bipolar I vs. bipolar II disorders. International Journal of Neuropsychopharmacology, 6, 127–137.Crossref, Medline, Google Scholar
(2000). A comparison of nefazodone, the Cognitive Behavioral Analysis System of Psychotherapy, and their combination for the treatment of chronic depression. New England Journal of Medicine, 342, 1462–1470.Crossref, Medline, Google Scholar
(2000). Five-year course and outcome of dysthymic disorder: A prospective, naturalistic follow-up study. American Journal of Psychiatry, 157, 931–939.Crossref, Medline, Google Scholar
(2006). Ten-year prospective follow-up study of the naturalistic course of dysthymic disorder and double depression. American Journal of Psychiatry, 163, 872–880.Crossref, Medline, Google Scholar
(2009). Cognitive behavioral analysis system of psychotherapy and brief supportive psychotherapy for augmentation of antidepressant nonresponse in chronic depression: The REVAMP Trial. Archives of General Psychiatry, 66, 1178-1188.Crossref, Medline, Google Scholar
, (July, 2012). DSM-IV-TR diagnostic methodology and diagnostic decision-guide procedure: fall semester, Psychology 616. Richmond, VA: Virginia Commonwealth University. Unpublished manuscript.Google Scholar
, (2001). Skills training manual for diagnosing and treating chronic depression: CBASP. New York: Guilford Press.Google Scholar
, (2012). The way early-onset chronically depressed are treated today makes me sad. Open Journal of Psychiatry, 2, 9–11.Crossref, Google Scholar
(1996). Differential diagnosis of chronic depressive disorders. Psychiatric Clinics of North America, 19, 55–71.Crossref, Medline, Google Scholar
(2015). CBASP as a distinctive treatment for persistent depressive disorder: Distinctive features series (pp. 19–20, 63–66). London: Routledge: Taylor & Francis Group.Google Scholar
(1994). Revised GAF Scale to assess patients symptom influence on their psychosocial functioning. Richmond, VA: Virginia Commonwealth University. Unpublished manuscript.Google Scholar
(2003). Morbidity in 258 bipolar outpatients followed for 1 year with daily prospective ratings on the NIMH Life Chart Method. Journal of Clinical Psychiatry, 64(6), 680–690.Crossref, Medline, Google Scholar


